Time Series Classification
Time Series Classification with SKTime and SKLearn
Time Series Classification with SKTime

Resources
- Overview of time series analysis Python packages
- sktime - A Unified Toolbox for ML with Time Series - Markus Löning | PyData Global 2021
- GitHub SKTime Tutorial
!pip install sktime
Methodology
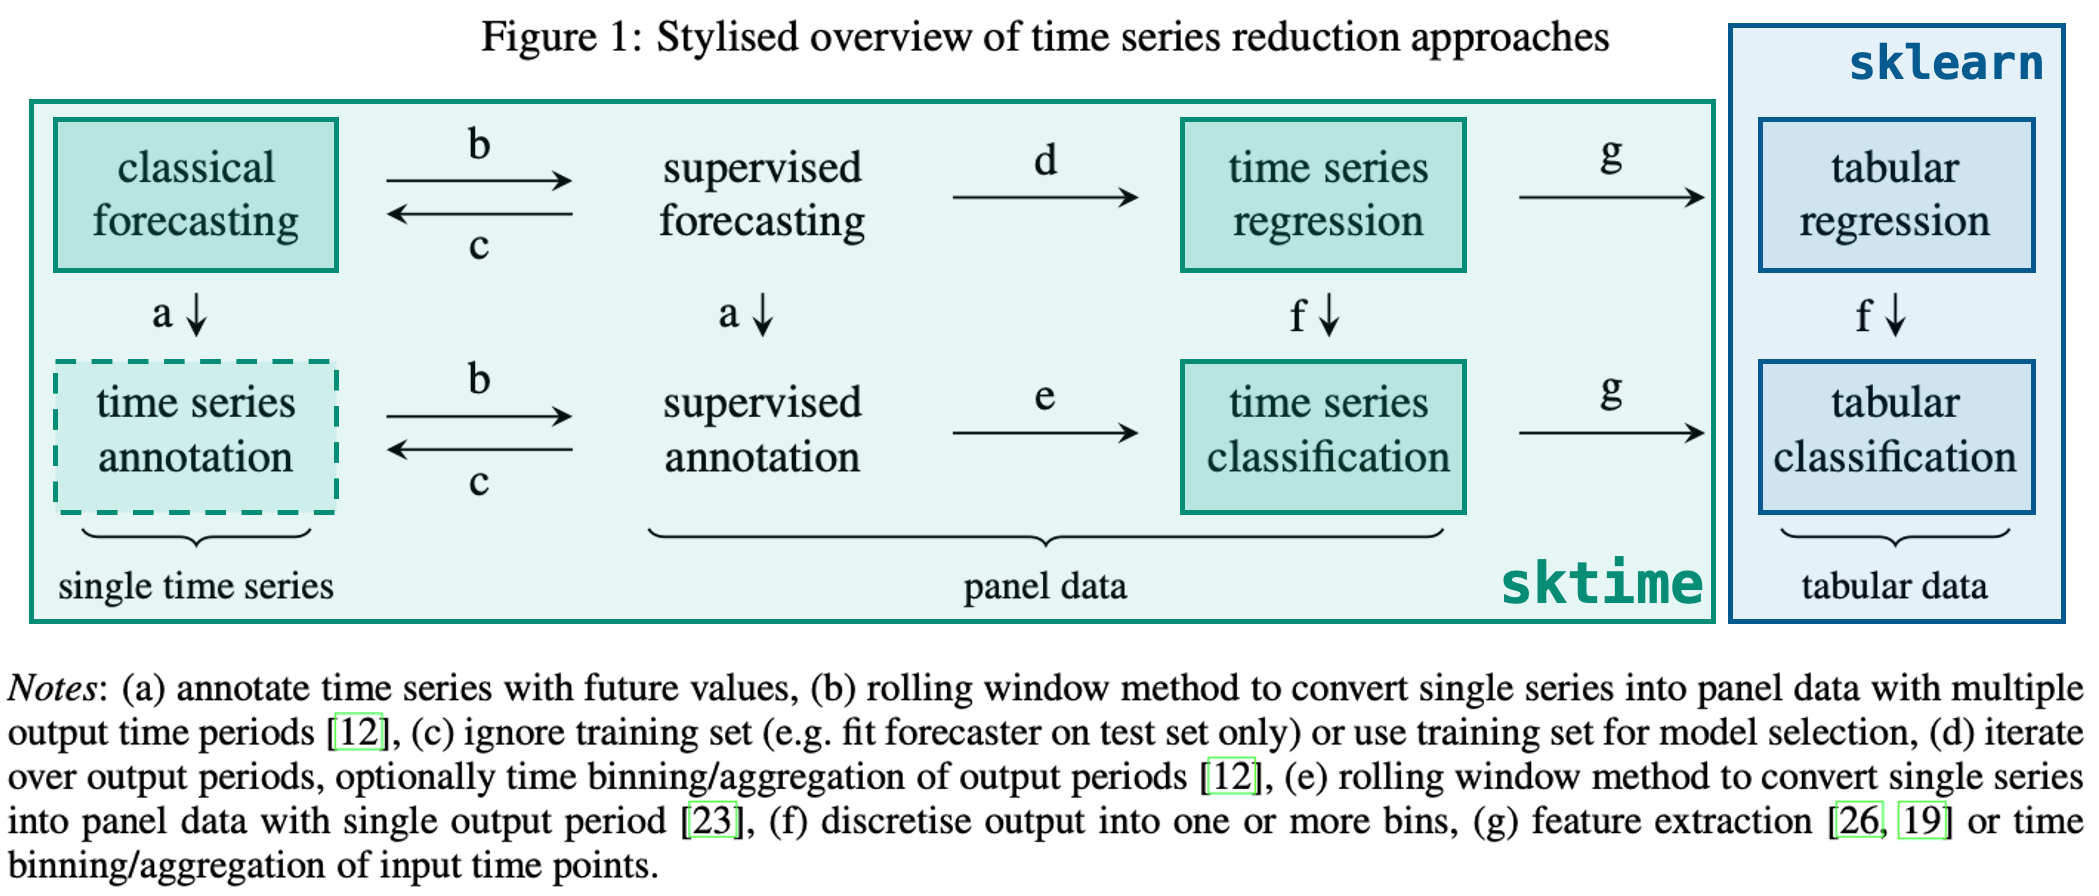
Using sktime for classification is similar to using it for forecasting wherein there are either predefined models or we can transform exising sklearn models to make them usable with time series data
Importing Data
We can import the arrow head dataset and graph some of the entries
import pandas as pd

from sktime.datasets import load_arrow_head
from sktime.utils.plotting import plot_series
from sklearn.model_selection import train_test_split
X, y = load_arrow_head()
X.head()
| dim_0 | |
|---|---|
| 0 | 0 -1.963009 1 -1.957825 2 -1.95614... |
| 1 | 0 -1.774571 1 -1.774036 2 -1.77658... |
| 2 | 0 -1.866021 1 -1.841991 2 -1.83502... |
| 3 | 0 -2.073758 1 -2.073301 2 -2.04460... |
| 4 | 0 -1.746255 1 -1.741263 2 -1.72274... |
y[:5]
array(['0', '1', '2', '0', '1'], dtype='<U1')
X_0 = list(X['dim_0'][0])
plot_series(pd.Series(X_0))
(<Figure size 1152x288 with 1 Axes>, <AxesSubplot:>)
<Figure size 1152x288 with 1 Axes>

X_1 = list(X['dim_0'][1])
plot_series(pd.Series(X_1))
(<Figure size 1152x288 with 1 Axes>, <AxesSubplot:>)
<Figure size 1152x288 with 1 Axes>

Train/Test Split
Train/Test splitting can be cone using sklearn as normal since each row is a different series/observation
from sklearn.model_selection import train_test_split
X_train, X_test, y_train, y_test = train_test_split(X, y)
Using a Classifier
sktime has built in classifiers that can be used as normal sklearn classifiers:
from sktime.classification.interval_based import TimeSeriesForestClassifier
classifier = TimeSeriesForestClassifier()
classifier.fit(X_train, y_train)
TimeSeriesForestClassifier()
And predictions can be made using the predict method:
y_pred = classifier.predict(X_test)
Model Evaluation
We can also check the accuracy using normal sklearn metrics, for example accuracy_score
from sklearn.metrics import accuracy_score
accuracy_score(y_test, y_pred)
0.9056603773584906
from sklearn.metrics import confusion_matrix
from sklearn.metrics import confusion_matrix, ConfusionMatrixDisplay

matrix = confusion_matrix(y_test, y_pred)
disp = ConfusionMatrixDisplay(matrix)
disp.plot()
<sklearn.metrics._plot.confusion_matrix.ConfusionMatrixDisplay at 0x7f826205ddd0>
<Figure size 432x288 with 2 Axes>

Use with SKLearn Classifiers
sktime also allows the conversion of data such that it can be used with sklearn tabular classifiers. This is done by transforming the classifier using the Tabularizer in a sklearn pipeline
from sklearn.ensemble import GradientBoostingClassifier
from sklearn.pipeline import make_pipeline

from sktime.transformations.panel.reduce import Tabularizer
classifier = make_pipeline(Tabularizer(), GradientBoostingClassifier())
classifier.fit(X_train, y_train)
Pipeline(steps=[('tabularizer', Tabularizer()),
,                ('gradientboostingclassifier', GradientBoostingClassifier())])
y_pred = classifier.predict(X_test)
accuracy_score(y_test, y_pred)
0.9056603773584906
matrix = confusion_matrix(y_test, y_pred)
disp = ConfusionMatrixDisplay(matrix)
disp.plot()
<sklearn.metrics._plot.confusion_matrix.ConfusionMatrixDisplay at 0x7f8261ebb810>
<Figure size 432x288 with 2 Axes>
